Tax Base by Zone
Zoning
Looking at all the property in the city, how much tax base is in each zoned category.
Zoning and the connection to the tax base
During the election campaign, most people I talked to were concerned with their taxes. Residents want to know how much money is being raised, where it is being spent, and why taxes never seem to go down.
I believe that in a tax-capped city like ours, residential tax relief comes through growth, specifically growth in the commercial tax base.
I pulled tax records from our AxisGIS geographic information system for the city and combined it with zoning data to get a sense of where our current tax base is coming from. These data are not perfect, but I believe they are good enough for a good-faith discussion.
The table below shows where our tax base comes from. I’m assuming all property is taxed equally, at the last municipal rate 0.01763 , or $17.63 per $1000. I also assume that city property and conservation land is taxed. There are areas that are not zoned in this dataset, and some of these properties have been reassessed since I pulled this data.
We have close to 3500 properties on the tax rolls, which generate about 19 million dollars in revenue for the city. That is a lot of money and a good reminder of the scale of the city’s operation.
The FY26 budgeted revenues adopted by the council are $20,402,954. While this analysis does not match exactly ($582,748 difference), at a high level, it shows that our dataset is still close enough to draw some conclusions.
The difference between the budgeted revenues and the estimated tax revenues is a limitation in using publicly available data, not mismanagement by the city.
Residential Taxes Contribute the Majority of City Taxes
Splitting the estimated tax value of Franklin’s properties by zone shows where the majority of the tax revenue lies.
We can show these data graphically as well.
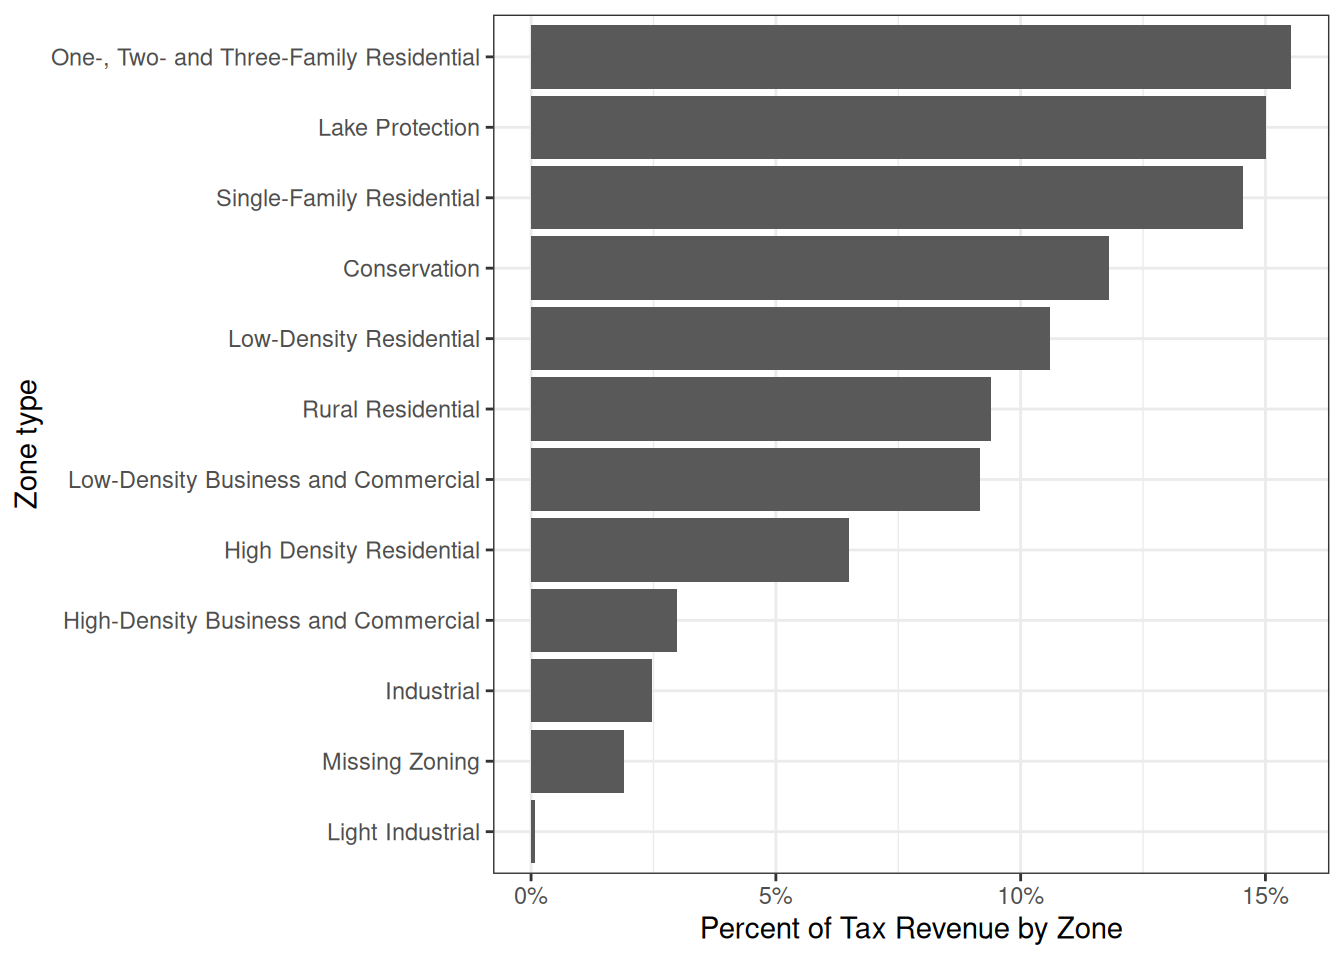
This table shows that the majority of the city’s revenue is paid by the residents of the city. This should not be a surprise. We are responsible for funding our community.
One way to offset the residential tax burden is to grow the commercial tax base. In the chart above, the combined commercial and industrial tax contribution is less than 5%. This is not an argument to build factories on every square inch of space in the city.
It is also worth noting that the tax value of conservation land throughout the city is more than 10%. This underscores our community’s investment in conservation. I believe this is good, it preserves the natural beauty of Franklin for future generations.
Industrial/Commercial Properties Pay the Most Tax Per Property
One other way to look at these data is to calculate the average tax per property for each zone category. To calculate this, divide the total tax value in a given zone type by the number of properties in that zone type. This assumes that every property in a given zone type is equal – it is not. Future posts may explore a more representative tax-by-zone calculation. The chart below shows the average tax by zone type.
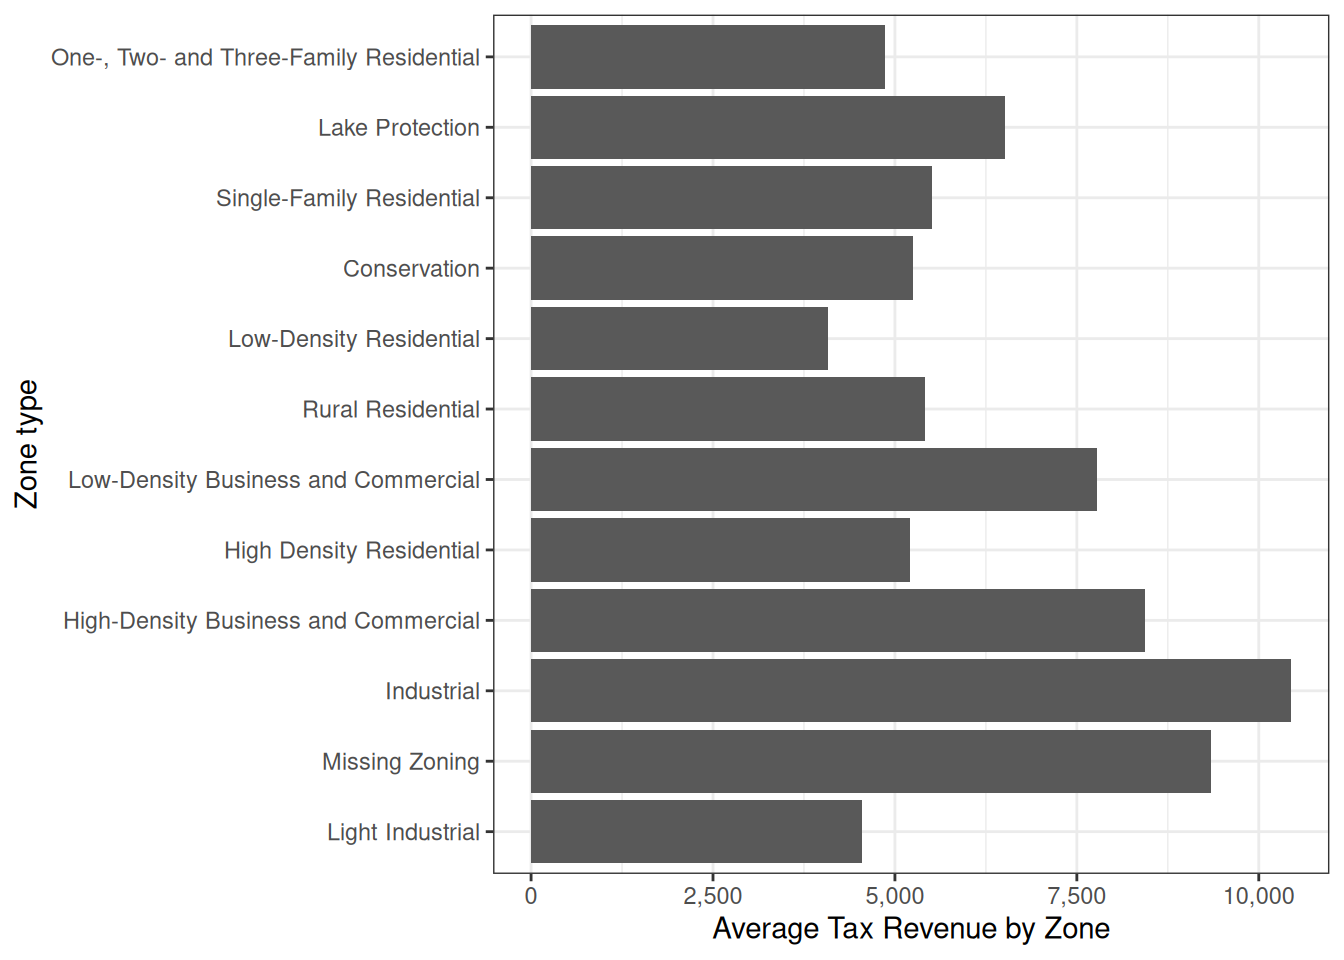
This chart shows that industrial and high- and low-density commercial properties already contribute more tax on average than an individual residential property. It also shows that, on average, properties in the lake protection district (around Webster Lake) are taxed a bit higher than other residential properties, but not by much. Finally, this chart shows that multi-family housing properties are, on average, taxed relatively low.
Putting all of this information together suggests that small increases to the number industrial and commercial properties could have a meaningful impact on city revenues.
As we head into budget season and budget visioning, a robust understanding of taxes – the main source of revenue for the city – is key for council and public decision making. Below is an interactive zoning map. If you’d like to talk about these data, calculations, or conclusions, feel free to email me at [email protected].